Bull & Bear Markets: A Timeline
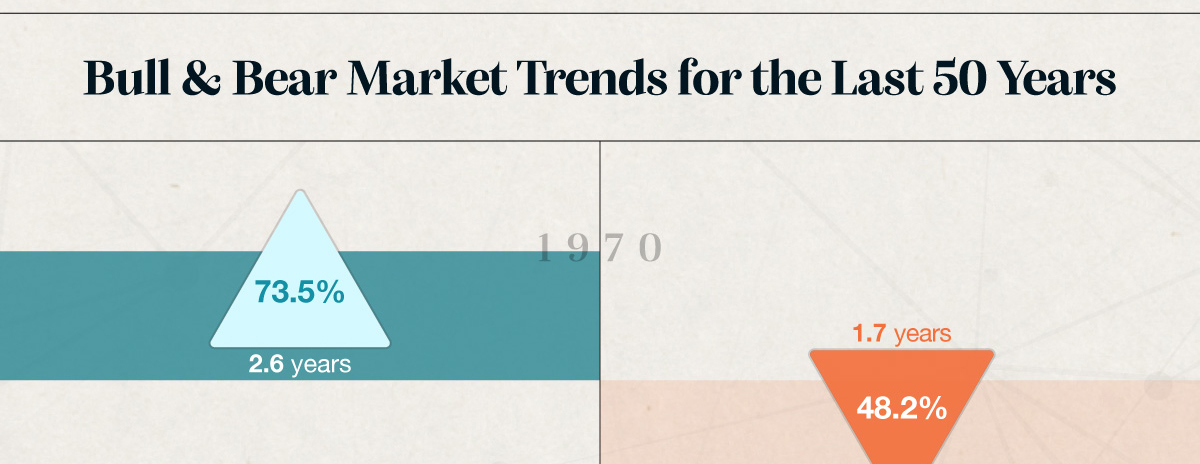
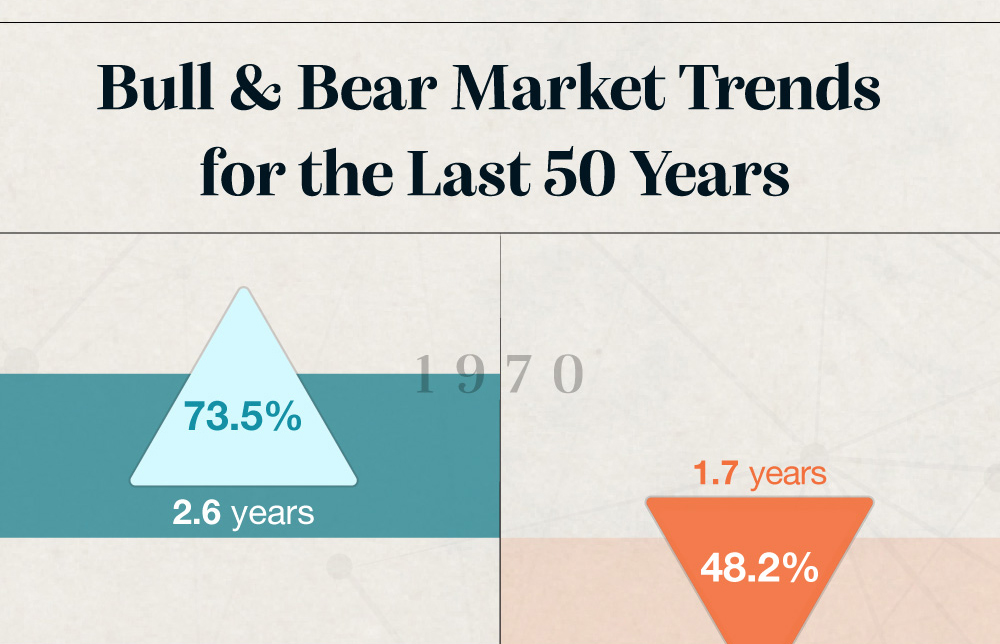
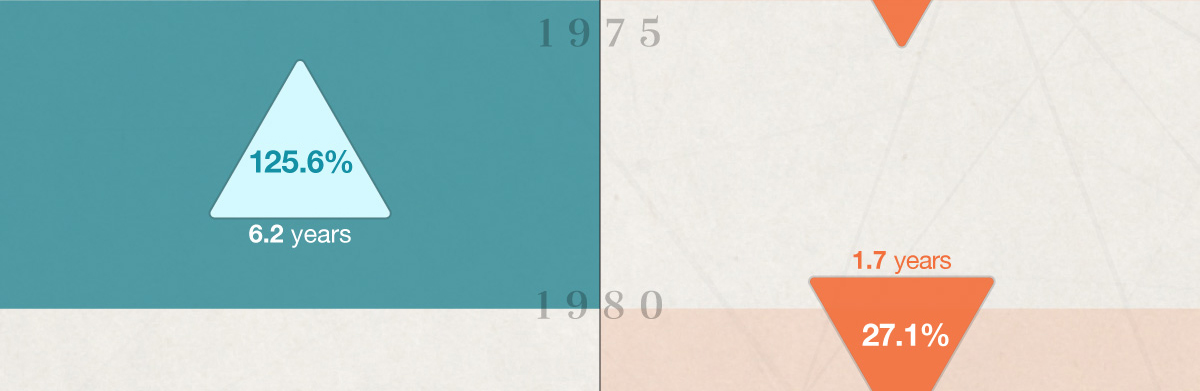
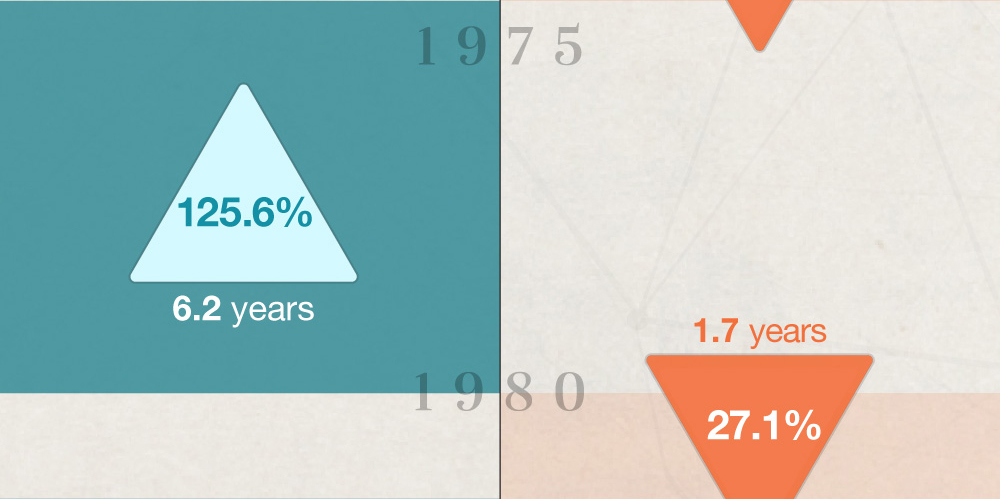

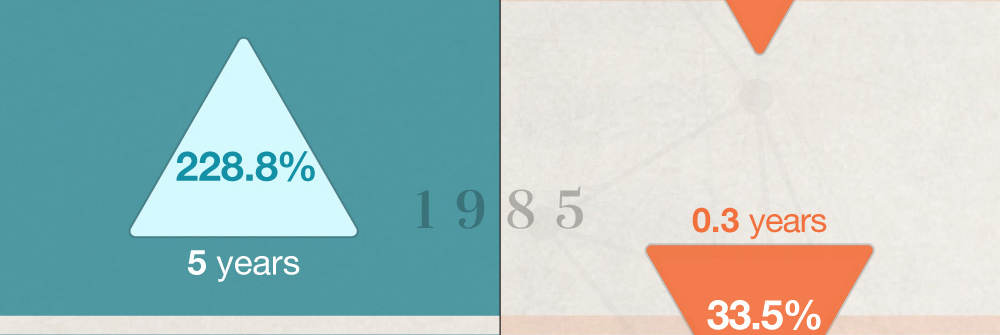
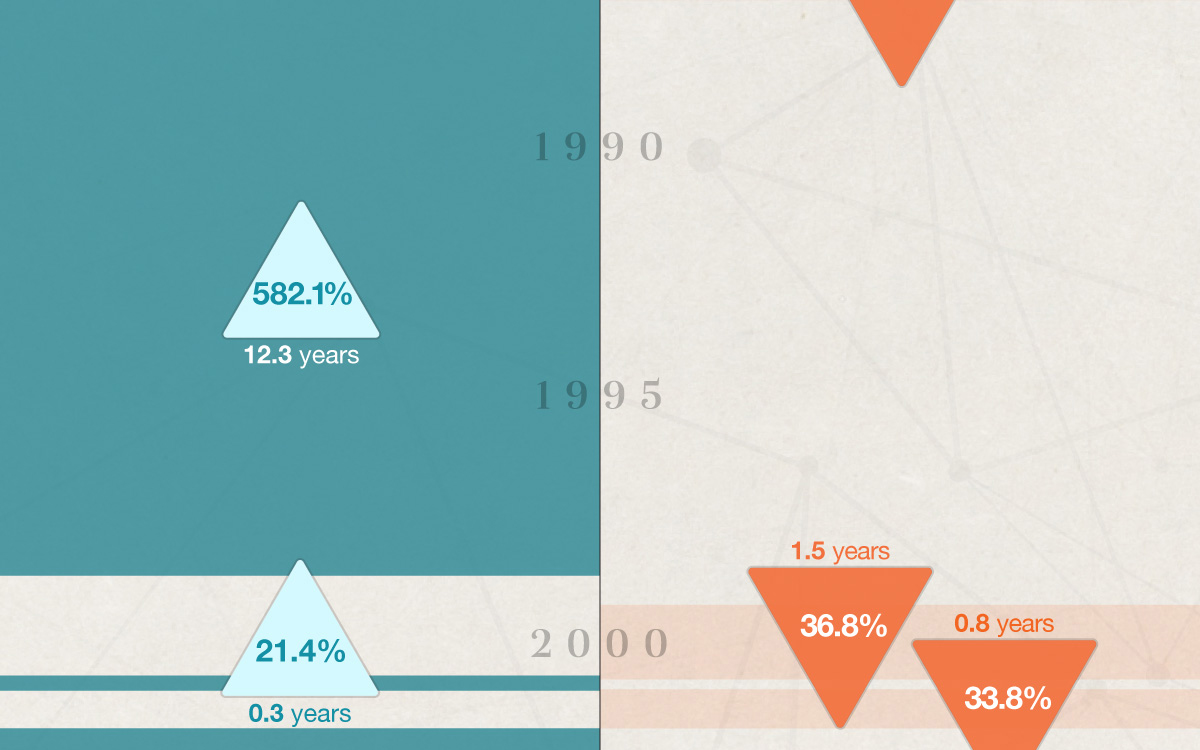
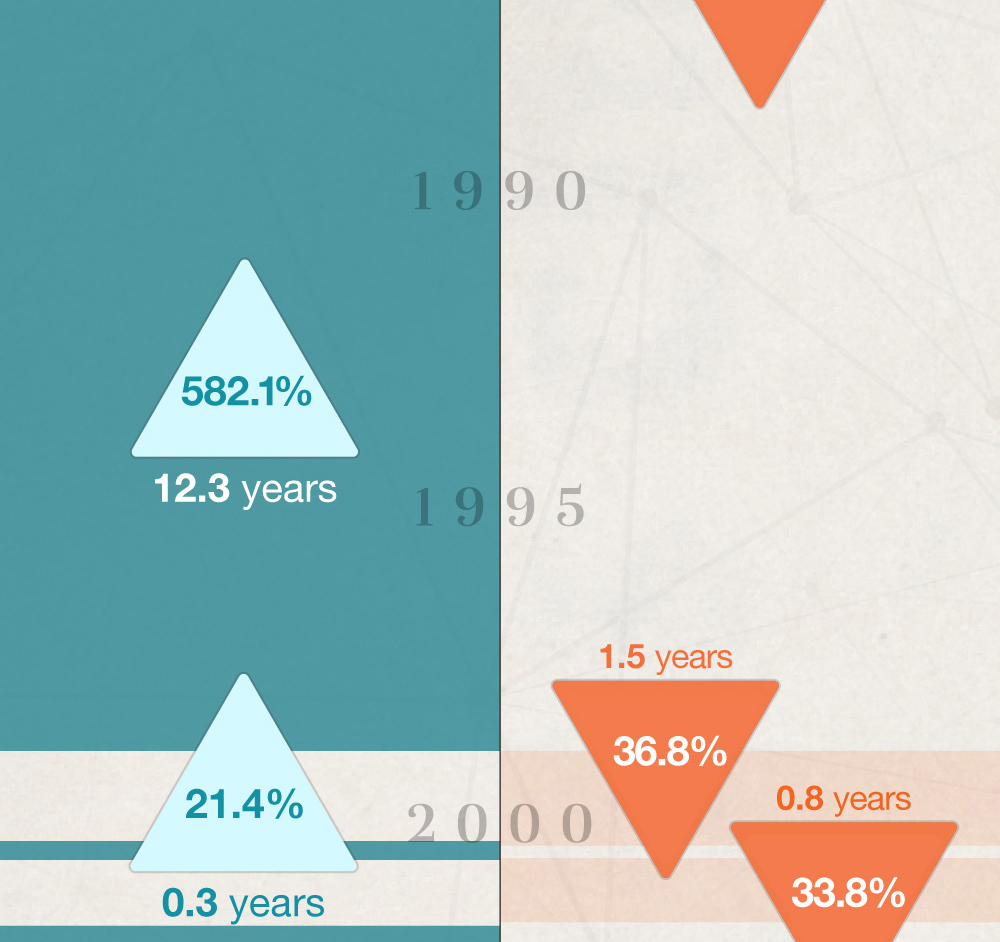
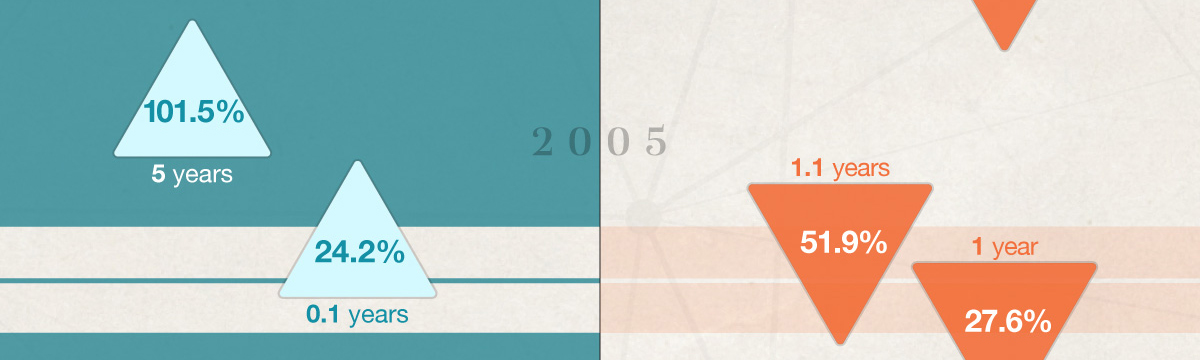
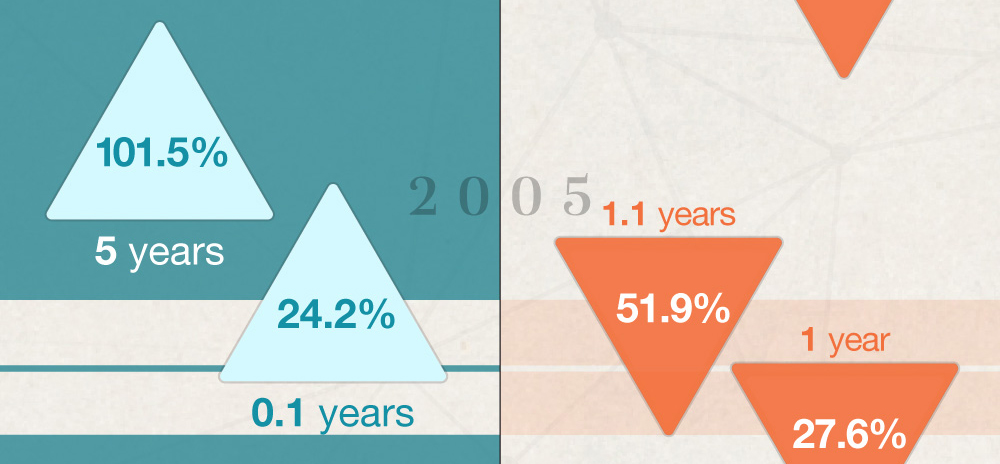
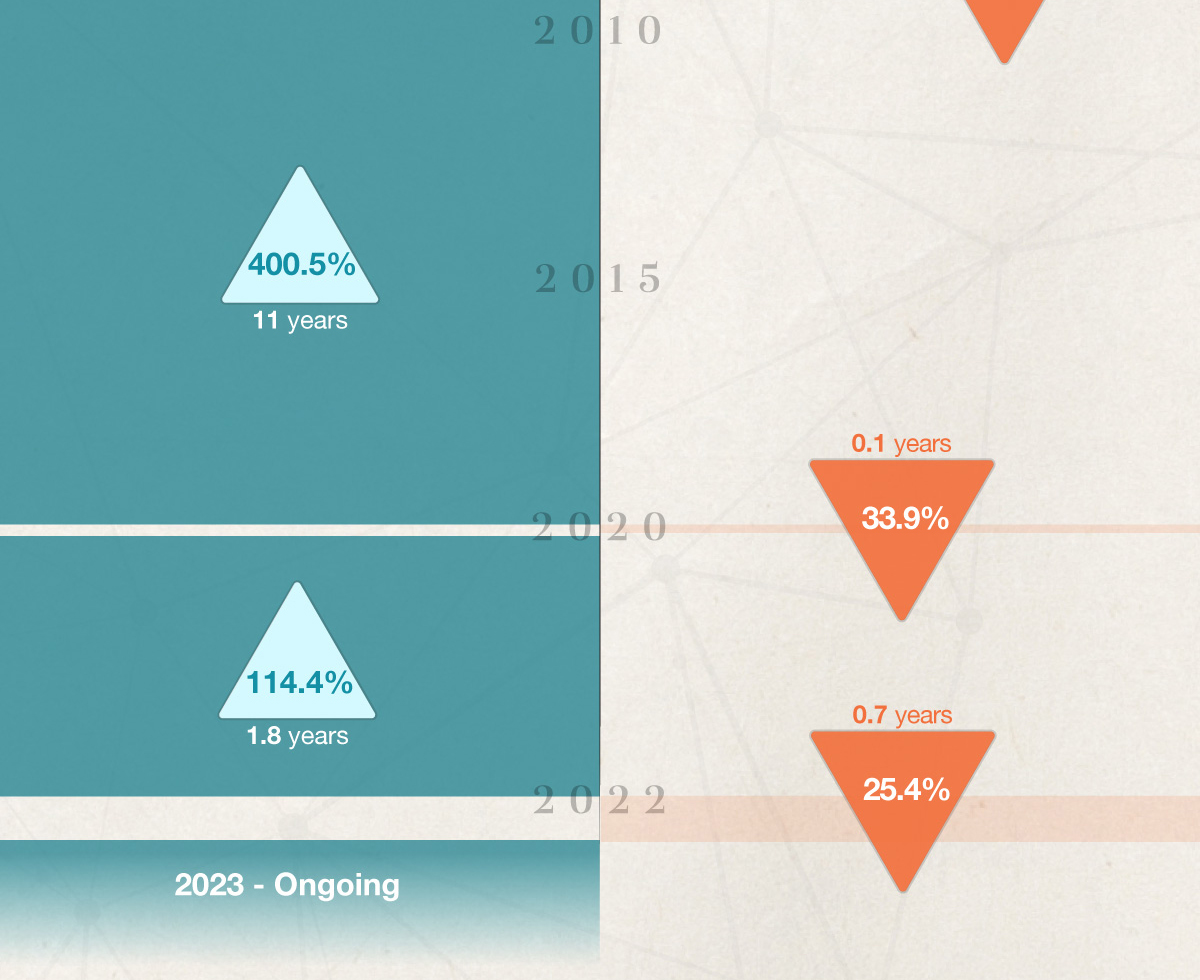
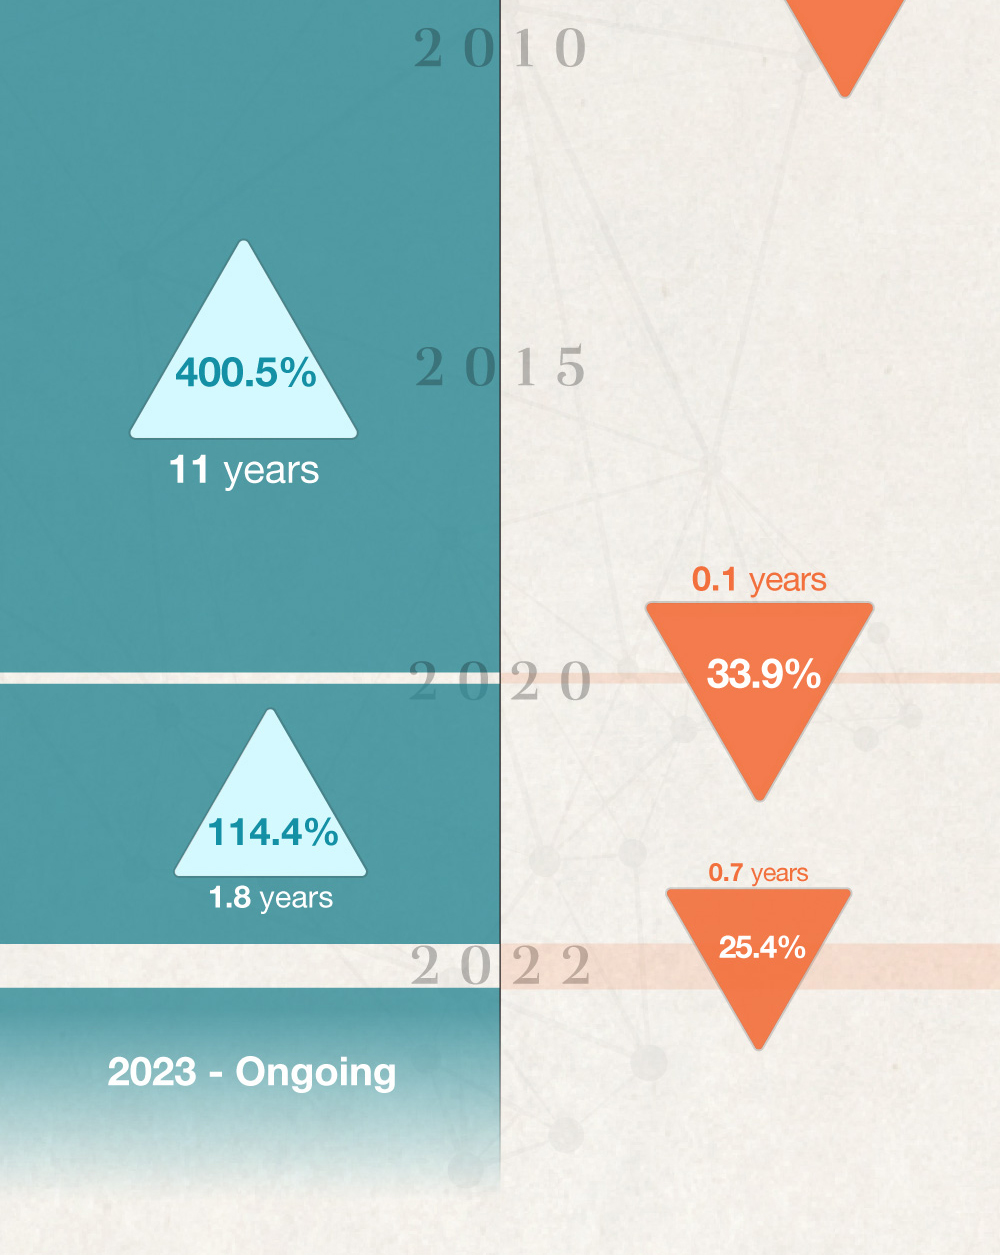


Tulips were the first, but they won’t be the last. What forms a “bubble” and what causes them to burst?

When it comes to generational differences, knowing the facts can be difficult.

Building wealth requires protection from the forces of wealth destruction.